
USMLE/COMLEX 3 - ECG
Start your One-Week Free Trial
Already subscribed? Log in »
Here are key facts for USMLE Step 3 & COMLEX-USA Level 3 from the Electrocardiogram tutorial, as well as points of interest at the end of this document that are not directly addressed in this tutorial but should help you prepare for the boards. See the tutorial notes for further details and relevant links.
- --
VITAL FOR USMLE/COMLEX 3
ECG Basics
1. Records electrical activity of the heart muscle.
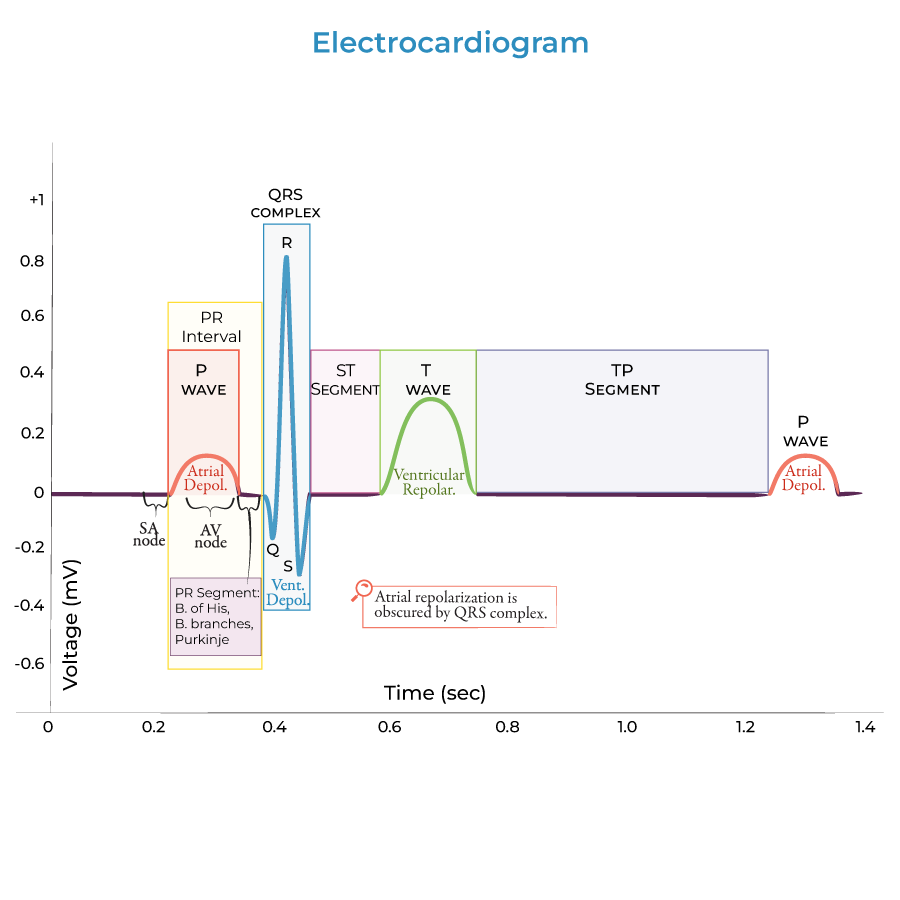
2. Comprises 5 waves: P, Q, R, S, and T.
3. Segments represent time spent at baseline voltage.
4. Intervals include both segments and waves.
Conduction Pathway
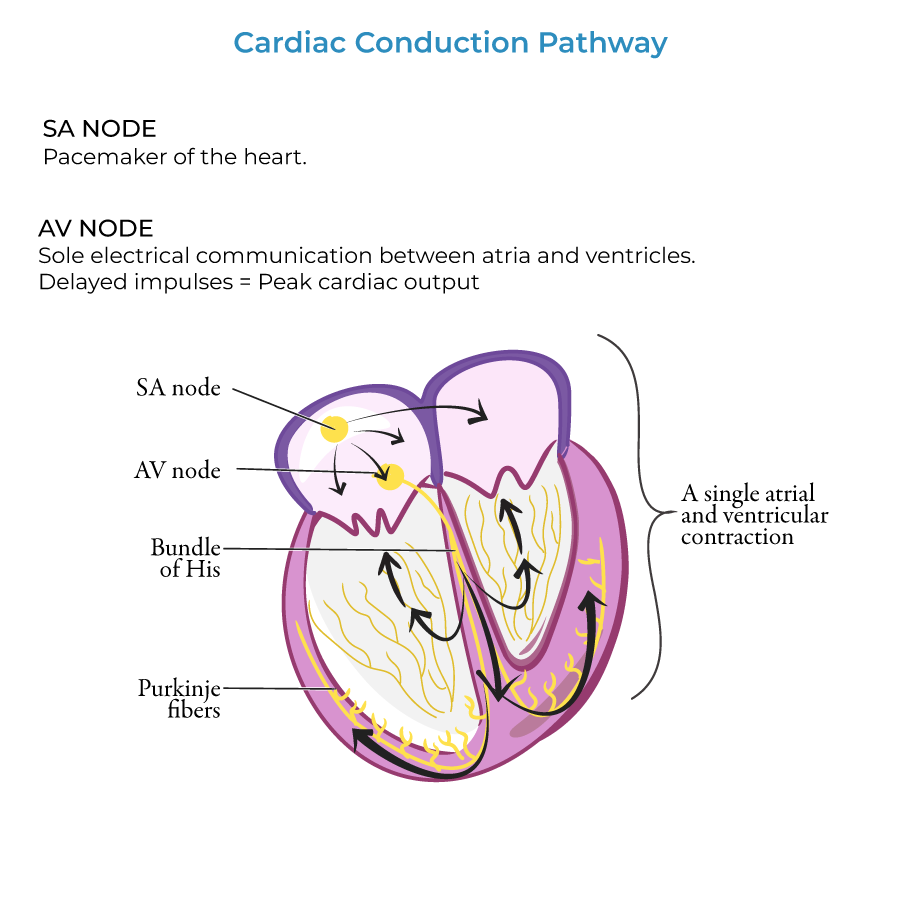
1. Sinoatrial (SA) node is the pacemaker of the heart; sets the heart's rhythm.
2. AV node transmits signals to the bundle of His (AV bundle).
3. Signals travel through right and left bundle branches to the apex of the heart.
4. Purkinje fiber network spreads electrical signals throughout ventricular cardiac muscle cells.
Key ECG Components
1. P wave: reflects atrial depolarization; atrial contraction occurs during latter part of P wave.
2. QRS complex: reflects ventricular depolarization; wide QRS indicates impaired ventricular conduction.
3. T wave: wider and taller than P wave; reflects ventricular repolarization.
4. PR interval: begins at start of P wave and ends at start of QRS complex (normal: 0.12-0.20 seconds).
5. ST segment: begins after QRS complex and ends at onset of T wave.
- --
HIGH YIELD
Electrochemistry Fundamentals
1. Depolarization occurs when membrane potential becomes more positive.
2. Repolarization occurs when membrane potential returns to negative.
3. Normal resting potential of ventricular cardiac cells is approximately -90 millivolts.
Important Intervals and Segments
1. PR interval longer than 0.20 seconds may indicate AV conduction block.
2. PR segment encompasses time between end of P wave and onset of QRS complex.
3. Within PR interval, AV node fires, sending electrical signal through conduction system.
4. ST segment reflects the period of ventricular ejection of blood into great vessels.
Clinical Correlations
1. U wave may occasionally appear after T wave.
2. Prominent U wave may reflect bradycardia, hypokalemia, ischemia, or effects of antiarrhythmic drugs.
3. Heart rate calculated using PP interval (distance between successive P waves) or RR interval (distance between successive R waves).
- --
Beyond the Tutorial
Advanced ECG Interpretation
1. QRS complex obscures atrial repolarization on the ECG tracing.
2. Ventricular contraction begins during QRS complex and continues through ST segment.
3. Isovolumetric contraction specifically begins during the QRS complex.
4. Unlike action potential graphs, wave shape doesn't directly indicate depolarization or repolarization - both P wave (depolarization) and T wave (repolarization) are positive.
5. ECG shows direction of current flow relative to the lead's axis.
6. Ventricular depolarization and contraction begins at the apex and moves towards the atria - this pathway effectively moves blood out of ventricles.