
USMLE/COMLEX 1 - ECG
Start your One-Week Free Trial
Already subscribed? Log in »
Here are key facts for USMLE Step 1 & COMLEX-USA Level 1 from the Electrocardiogram/ECG, EKG tutorial, as well as points of interest at the end of this document that are not directly addressed in this tutorial but should help you prepare for the boards. See the tutorial notes for further details and relevant links.
 Below is information not explicitly contained within the tutorial but important for USMLE & COMLEX 1.
- --
VITAL FOR USMLE/COMLEX 1
Basic ECG Principles & Components
1. Definition: ECG reflects and records the electrical activity of heart muscle by detecting extracellular signals produced by action potentials moving through cardiac muscle cells.
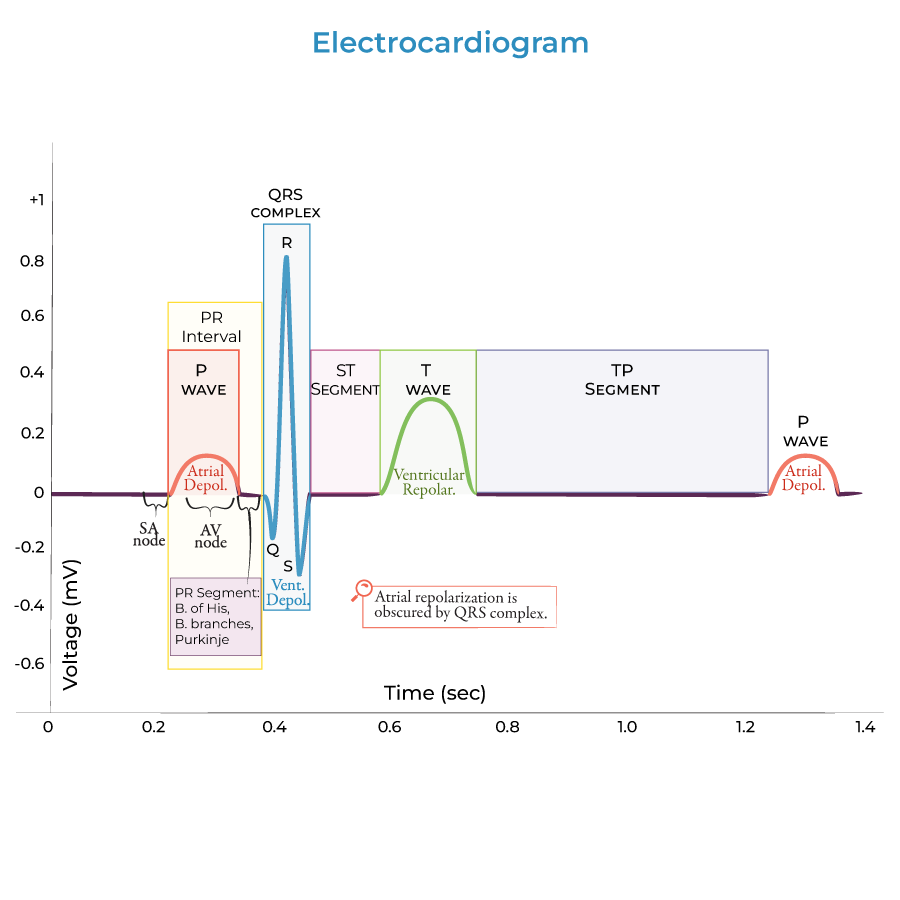
2. Basic Components:
- Waves: Visible movements above or below baseline voltage (P, Q, R, S, T)
- Segments: Time spent at baseline between waves
- Intervals: Include both segments and waves
- Depolarization: Membrane potential becomes more positive
- Repolarization: Membrane potential returns to negative (normal resting potential of ventricular cardiac cells is approximately -90 millivolts)
Cardiac Conduction Pathway
1. Sinoatrial (SA) Node: Heart's pacemaker that sets rhythm; sends electrical signals throughout atria and to atrioventricular (AV) node.
2. Atrioventricular (AV) Node: Transmits signals to bundle of His (AV bundle).
3. Bundle of His: Conducts signals to right and left bundle branches toward apex of heart.
4. Bundle Branches: Divide into right and left pathways.
5. Purkinje Fiber Network: Spreads electrical signals throughout ventricular cardiac muscle cells.
6. Functional Significance: Ensures ventricular depolarization/contraction begins at apex and moves toward atria, efficiently propelling blood out of ventricles.
ECG Waves & Their Physiologic Correlates
1. P Wave:
- Represents atrial depolarization
- Atrial contraction occurs during latter part of P wave
- Represents ventricular depolarization
- Wide QRS indicates impaired ventricular conduction (e.g., bundle branch block)
- Obscures atrial repolarization
- Wider and taller than P wave
- Represents ventricular repolarization
- Appears after T wave
- Prominent U wave may reflect bradycardia, hypokalemia, ischemia, or effects of antiarrhythmic drugs
ECG Intervals & Segments
1. PR Interval:
- Begins at start of P wave and ends at start of QRS complex
- Normal duration: 0.12-0.20 seconds
- Prolongation indicates AV conduction block
- Subset of PR interval between end of P wave and onset of QRS complex
- Represents conduction through AV node, bundle of His, bundle branches, and Purkinje fibers
- Begins after QRS complex and ends at onset of T wave
- Corresponds to early phase of ventricular repolarization
- Ventricular contraction continues through this segment
- From beginning of QRS to end of T wave
- Represents total duration of ventricular depolarization and repolarization
- Time between consecutive R waves
- Used to calculate heart rate
Electromechanical Correlation
1. Electrical-Mechanical Sequence:
- SA node fires just prior to P wave (not visible on ECG)
- Atrial contraction follows atrial depolarization (P wave)
- Ventricular contraction begins during QRS complex and continues through ST segment
- Isovolumetric contraction begins during QRS complex
- ST segment reflects period of ventricular ejection into great vessels
- ECG can determine heart rate via PP or RR intervals
- Wave morphology provides insight into underlying cardiac pathophysiology
- --
HIGH YIELD
ECG Wave Morphology & Significance
1. P Wave Characteristics:
- Small, positive deflection
- Normal duration <0.12 seconds, amplitude <2.5 mm
- Reflects sequential depolarization of right then left atrium
- Q wave: First negative deflection (if present)
- R wave: First positive deflection
- S wave: Negative deflection following R wave
- Normal duration <0.12 seconds
- Widening indicates conduction delay in ventricles
- Normally positive in most leads
- Represents heterogeneous ventricular repolarization
- T wave inversion may indicate ischemia, strain, or electrolyte abnormalities
- Not always present
- Seen best in precordial leads V2-V4
- Prominent in hypokalemia, bradycardia, and with certain medications
Conduction System Physiology
1. Inherent Automaticity Rates:
- SA node: 60-100 beats per minute (normal pacemaker)
- AV node: 40-60 beats per minute (backup pacemaker)
- Purkinje fibers: 20-40 beats per minute (tertiary pacemaker)
- Atrial myocardium: Moderate conduction speed
- AV node: Slowest conduction (provides critical delay)
- His-Purkinje system: Fastest conduction
- Sympathetic stimulation: Increases automaticity and conduction velocity
- Parasympathetic stimulation: Decreases automaticity and conduction velocity, primarily affecting SA and AV nodes
- Absolute refractory period: Cell cannot be restimulated
- Relative refractory period: Cell can be restimulated with stronger stimulus
Interval Interpretation
1. PR Interval Analysis:
- Short PR (<0.12 sec): Pre-excitation syndromes, junctional rhythm
- Long PR (>0.20 sec): First-degree AV block, hyperkalemia, drugs (beta-blockers, calcium channel blockers)
- Prolonged (>0.12 sec): Bundle branch blocks, hyperkalemia, ventricular rhythms
- Environmental and pharmacological influences on QRS morphology
- Corrected for heart rate (QTc)
- Prolonged QTc: Congenital long QT syndromes, hypokalemia, hypocalcemia, medications
- Shortened QTc: Hypercalcemia, digitalis effect
- Elevation: Myocardial infarction, pericarditis, Brugada syndrome
- Depression: Subendocardial ischemia, digoxin effect, hypokalemia
ECG and Cardiac Cycle Integration
1. Electromechanical Delay: Brief lag between electrical activation and mechanical contraction.
2. Pressure-Volume Relationships:
- QRS coincides with isovolumetric contraction
- ST segment correlates with ventricular ejection
- T wave generally occurs during isovolumetric relaxation and early diastolic filling
- P wave precedes atrial pressure increase
- QRS precedes ventricular pressure increase
- Aortic valve opening occurs early in ST segment
- Aortic valve closure approximately coincides with T wave
- S1 (lub): Shortly after QRS onset, representing AV valve closure
- S2 (dub): Near T wave completion, representing semilunar valve closure
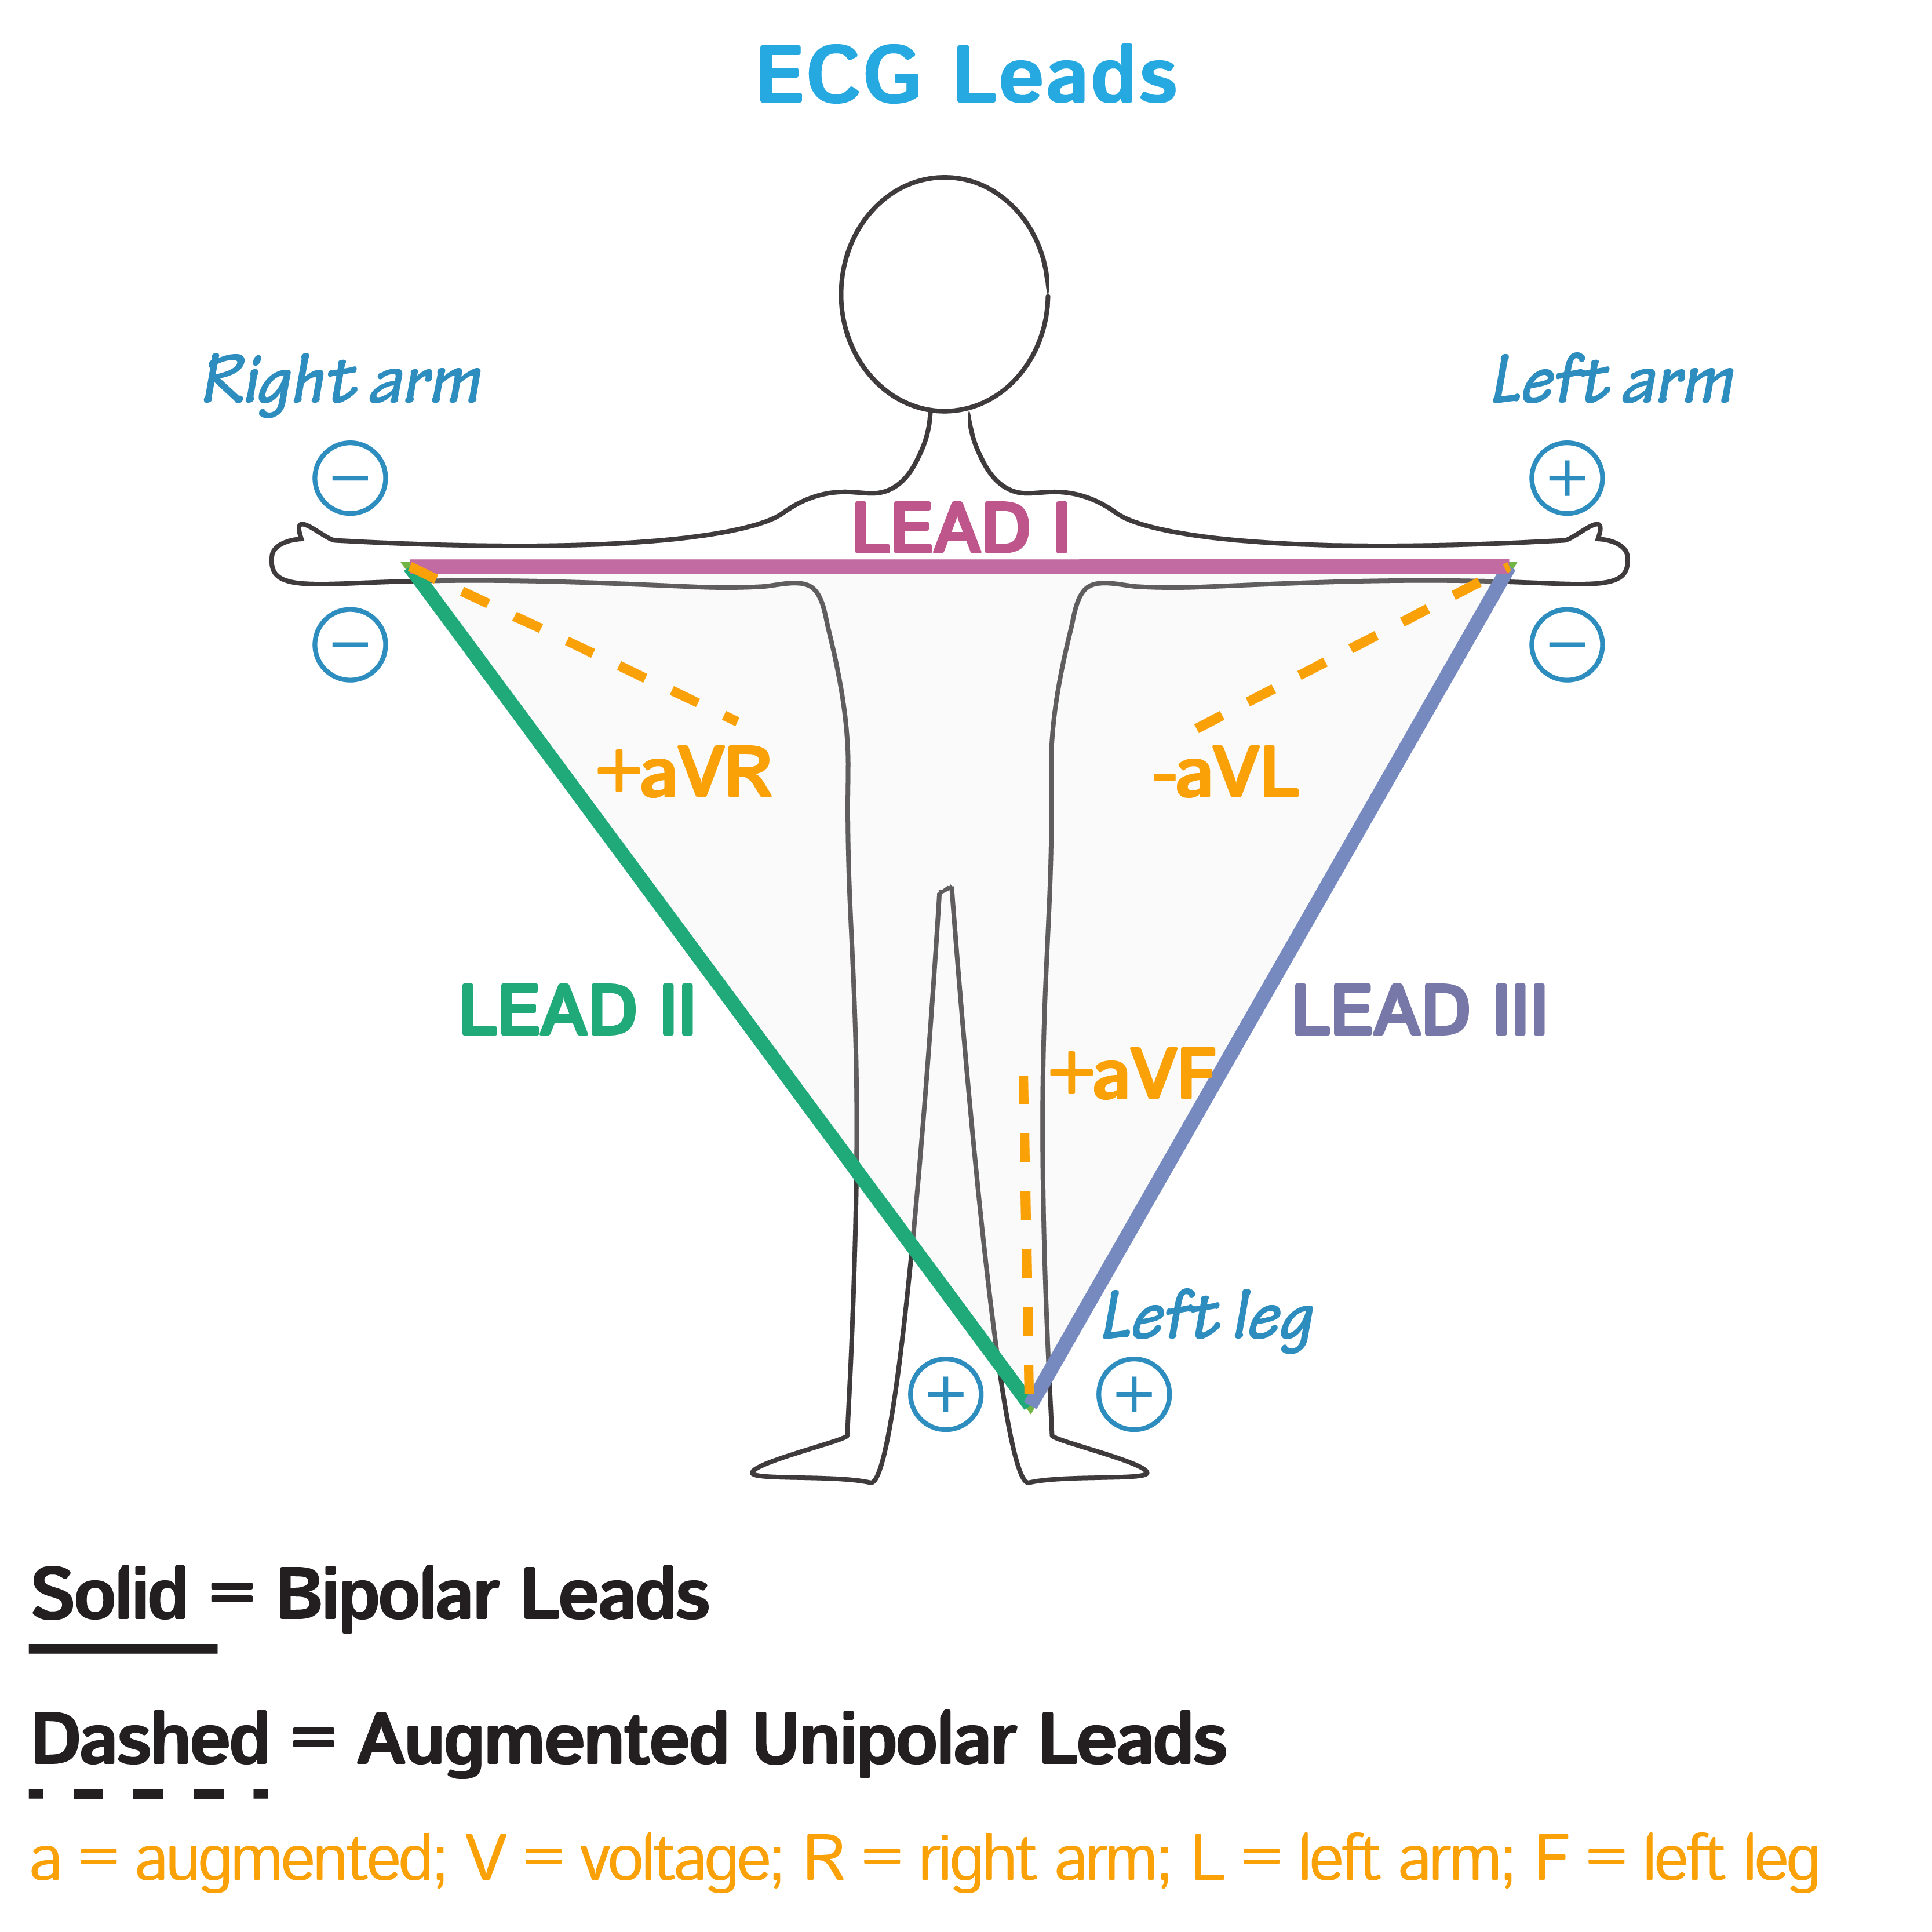
Lead Systems & Spatial Orientation
1. Lead Positioning:
- Standard 12-lead ECG: Combination of limb leads and precordial leads
- Each lead views heart from different angle
- Limb leads (I, II, III) and augmented leads (aVR, aVL, aVF)
- Provide views of heart in vertical plane
- Precordial leads (V1-V6)
- Provide views of heart in horizontal plane
- Einthoven's triangle: Relationship between leads I, II, and III
- Kirchhoff's law: I + (−II) + III = 0
- --
Beyond the Tutorial
Ion Channel Physiology & ECG Correlation
1. Phase 0 (Rapid Depolarization): Fast Na+ channels open, corresponds to beginning of QRS complex in ventricular cells.
2. Phase 1 (Early Repolarization): Transient K+ outflow, corresponds to J point (end of QRS).
3. Phase 2 (Plateau): Balance between Ca2+ inflow and K+ outflow, corresponds to ST segment.
4. Phase 3 (Rapid Repolarization): K+ channels dominant, corresponds to T wave.
5. Phase 4 (Resting Potential): Maintained by Na+/K+ ATPase, corresponds to TP interval (baseline).
Common ECG Abnormalities
1. Arrhythmias: Atrial fibrillation, ventricular tachycardia, heart blocks, premature contractions.
2. Ischemic Changes: ST elevation/depression, T wave inversion, pathological Q waves.
3. Chamber Abnormalities: Atrial/ventricular hypertrophy patterns, axis deviations.
4. Electrolyte Disturbances: Hypo/hyperkalemia, hypo/hypercalcemia, hypo/hypermagnesemia effects.
5. Drug Effects: Digitalis, antiarrhythmics, psychotropics, and other medication influences on ECG.
Advanced ECG Calculations
1. Heart Rate Calculation Methods:
- 300 ÷ number of large boxes between consecutive R waves
- Count number of R waves in 6-second strip and multiply by 10
- Using quadrant method with leads I and aVF
- Net QRS deflection across multiple leads
- Left ventricular: S in V1 + R in V5/V6 > 35 mm
- Right ventricular: R in V1 > 7 mm or R/S ratio in V1 > 1
Cellular Basis of ECG Abnormalities
1. Ischemia Progression: Cellular changes from ischemia to injury to infarction and corresponding ECG changes.
2. Electrophysiologic Remodeling: Changes in ion channel expression and function in disease states.
3. Autonomic Influences: Molecular mechanisms of sympathetic and parasympathetic effects on cardiac conduction.
4. Cardiac Memory: Persistent T wave changes after periods of abnormal ventricular activation.
5. Channelopathies: Genetic ion channel defects and their ECG manifestations (Long QT, Brugada, Short QT).
Special ECG Patterns & Syndromes
1. Brugada Pattern: ST elevation in right precordial leads with right bundle branch block appearance.
2. Wellens Syndrome: Biphasic or deeply inverted T waves in V2-V3, indicating LAD stenosis.
3. Torsades de Pointes: Polymorphic ventricular tachycardia with "twisting of the points" appearance.
4. Early Repolarization: J-point elevation, commonly a normal variant but sometimes pathological.
5. Wolff-Parkinson-White: Pre-excitation with short PR interval and delta wave due to accessory pathway.